Sunday 1 November 2015

Conversion rate on mobile is really equal to conversion rate on desktop

I’ll get the punchline in first. My thesis is that if you measure your conversion-rate as:

Checkouts per visitor-minute spent on your site

then most of the differences in conversion rate between device-types will evaporate, and you’ll discover that your mobile visitors convert just as well as your PC and tablet visitors.

Conversion rate on mobile equals conversion rate on desktop

To be more precise, my proposal is that checkouts per quantum of useful information/content consumed is the best measure of conversion; unfortunately this is very difficult to measure directly, and visitor-minutes is a reasonable proxy.

OK, so now for the back-story, analysis, and a request for some data-sharing.

I’m currently doing the research needed to bring my book ‘The Multichannel Retail Handbook’ back up to date. Obviously one of the chapters that most needs revising is the one on Mobile, because it’s an area that’s developed extraordinarily quickly, even since I wrote the previous edition in 2012.

I was peacefully trotting out a draft including the received wisdom that mobile visitors don’t convert as well as desktop or tablet visitors. There’s plenty of published statistics demonstrating this, and typically they quote a kind of 40:90:100 index for smart-phone:tablet:desktop conversion rates. On a typical retailer’s website, this might translate as conversion rates of 1.2%:2.7%:3.0% or something like that. Obviously it depends what you sell and so forth. The blended use of the term “mobile” meaning both smart-phone and tablet together makes me wince – the channels are totally different in usage and behaviours - but a generic mobile conversion rate is about 50 on the same index, or 1.5% as a percentage.

Nice charts make better books and articles, so I had a hunt through the Google Consumer Barometer 2014, for some extra supporting data, expecting it to tell me that people use their smart-phones for research, but not so much for purchasing, which also seems to be received wisdom. The actual data was rather confounding.

Google asks two questions, which I’ll paraphrase as:

Q1. Did you perform research in the last week on your device?
Q2. Did you buy a product or service in the last week on your device?

Clearly they get a percentage of respondents that says yes or no to each question. Where it gets rather interesting is if you express Q2 as a percentage of Q1. Essentially you are asking:

Q3. What % of people who researched online on a device also made a purchase online on that device, over the duration of a week?


Here are the results for a sample of countries:

Weekly aggregated conversion rates by device and country

In many countries – the UK, Germany, Japan, UAE and even Russia on this chart – the differences between mobile and desktop customers suddenly disappear. In most others they are much less than expected, and for China specifically the (not wholly unexpected) suggestion is that mobile converts better than desktop.

How, then, to reconcile this with the well-documented statistics that show that there’s a big difference? The answer appears to lie in the structure of the question. Notice that the Consumer Barometer asks about an extended time period: a week. It does not ask about ephemeral visits, visitors, or page-views.

Depending which studies you believe, most purchases have a consideration duration of somewhere between 2 days and 2 weeks, in countries where the internet retailing is well-established and therefore online research a prevalent shopper-behaviour. There’s a hint of some consistency here: Consumer Barometer asks about a week, shoppers take about a week to decide.

What we seem to be seeing is that a shopper needs to consume a consistent quantity of information in order to make a purchase decision. The ratio we’d really like to study is

Checkouts per quantum of information consumed

but that isn’t terribly easy to measure, so we need to look at some more accessible proxies for it.

One possibility is page-views. This is often a KPI, or wrapped into a more complex “engagement” KPI. But if you think about it in terms of quantity of information it’s unhelpful. A page on a mobile site often contains much less information, and even if it doesn’t, shoppers engage with mobile site pages differently. On desktop they read the detail, on mobile they just read the headlines, and moreover they may read in a much more interrupted environment such as while commuting.

Fortunately there’s a much better statistic: session-duration. The first thing this does is bear out the headlines vs detail idea. Here are the published session durations for the New York Times:

NY Times Data
Avg Pages per Visit
Avg Session Duration
Mobile
2.55
   1 min  43 secs
Desktop
3.58
17 mins 31 secs
(Data source: SimilarWeb/Clickz)

Much more importantly for a retailer, it also bears out the idea that checkouts per visitor-minute is a much better measure of the effectiveness of a given channel. Obtaining publishable conversion data for retailers is pretty tricky. We can at least test the hypothesis in print by considering session-duration data published for Amazon against generic conversion-rate data.


Generic Conversion Rate
Amazon Avg Session Duration
% conversion rate per minute session duration
Blended Mobile
1.5%
4 mins 38 secs
0.32%
Desktop
3.0%
8 mins 35 secs
0.35%
(Data source for Amazon: SimilarWeb/Clickz)

As if by magic, the conversion rate per visitor-minute is pretty much consistent across both channels! 

OK, one data point doesn’t make a case. Privately I’ve tested this against various data that clients have shared with me, and it does seem to stand up remarkably well, but unfortunately of course I can’t publish such data points.

It seems to “feel” right though: the quantity of checkouts you’ll get on a channel is proportional to the time (or more likely in reality, information) customers engage with you and glean some information or data that’s useful to them in what they’re doing. Viewed from the customer’s perspective, a successful visit to a site – a “conversion” from their point of view – is one where they succeed in finding out what they wanted to know.

They might do that staccato on mobile, gathering one bit of data and then looking elsewhere. Or they might do it legato on desktop or tablet, gathering multiple items in one trip. More likely they’re doing both, during the course of their decision-making process over a week or two. There’s a probability that this particular item of information, gathered on this particular visit, is the final piece in the jigsaw for them, and results in a conversion from your point of view. The chances of that happening on a given channel or device are proportional to the time-spent=information-gathered on that channel.

If this idea is right, it’s potentially a very good way of measuring the relative effectiveness of your user-experience by channel. Viewed overall it tends to suggest that the stereotype that mobile doesn’t convert anywhere nearly as well as desktop is simply wrong.

What would be really interesting is if there are sites out there willing to share data that supports or challenges this. For those worried about confidentiality, I’d simply note that you can use any arbitrary time-unit and then not make public what that time-unit was, provided you use it consistently across devices or channels, and then just report checkouts per internally measured session-duration unit by device-type.


Thursday 22 October 2015

Harry Potter and the Brands Lost by Retailers’ Site Search


  Professor Snape looked up at the class. “You are here to learn the subtle science and exact art of merchandising on retailers’ websites,” he began. “As there is little foolish brand-waving here, many of you will hardly believe it’s just about managing your retailers to get some basics working in your favour.”
  “Potter,” said Snape suddenly. “What would I get if I added sodium lauryl sulphate to an infusion of powdered glycol distearate?”
  “I don’t know,” said Harry quietly. “I think Hermione does, though, why don’t you try her?”
  “Sit down,” he snapped at Hermione, whose hand had shot into the air. “For your information, Potter, they are two of the main ingredients of shampoo.”
  Ron eyed Snape’s lank greasy locks, and sniggered.
  “Five points will be taken from Gryffindor,” snarled Snape. “And since you appear to find it so amusing, Mr Weasley, why don’t you take out your tablet now, and try to find some online appropriate to your needs?”
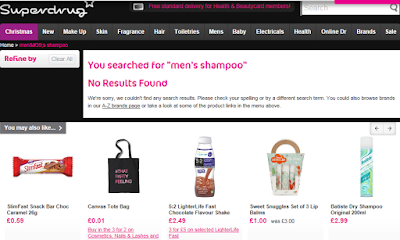
  He waved his wand and the search term “men’s shampoo” appeared on the blackboard. “The majority of consumers that don’t simply enter the brand name itself will use a generic search term of this type before trying to browse the site hierarchy,” he observed. “Come on, come on, what are you all waiting for?”
  Feeling that a pharmacy site would be safe place to start without attracting Snape’s attention any further, Harry started on the Superdrug website. The results were baffling. Ron looked over his shoulder and sniggered again. “Sweet Snuggles set of 3 lip balms! Were you looking for something, err, special Harry?”

No Results on Superdrug

  Snape swooped down on them. “Inevitably Potter,” he spat, “you’ve managed to start looking on a site that doesn’t maintain its search dictionary synonyms and stemming properly.” Disdainfully he removed the apostrophe, changing men’s to mens, tapped the screen, and shampoos magically appeared.
  “What opportunities does that give us, Mr Malfoy?”
  “As a brand, we could influence the static link from the term men’s shampoo to jump to a page pre-filtered for our brand, sir,” replied Malfoy with a cunning look.
  “We could indeed, Mr Malfoy. Ten points to Slytherin. What else do we notice?”
Hermione’s hand shot up again. “No one?” demanded Snape, deliberately not glancing at her.
  “The products are listed in alphabetic order,” squealed Hermione.
  “I don’t remember asking you to speak, Miss Grainger. However this is indeed the case.”

Search Results on Superdrug

  “What does that mean, Mr Malfoy?”
  “That you’re pretty unhappy if you you’re Toni & Guy, sir?”
  “Another ten points to Slytherin. Indeed you are. Well over 50% of add-to-carts from brand-agnostic customers will come from items listed in the first row of products in response to a generic search term.”
  “So these other brands should be trying to get Superdrug to change its default sort-order then sir?”
  “They should indeed. ‘Relevance’ or ‘top-sellers’ are more reasonable defaults. Possibly better still they could arrange for a product-placement at the top of this page.”
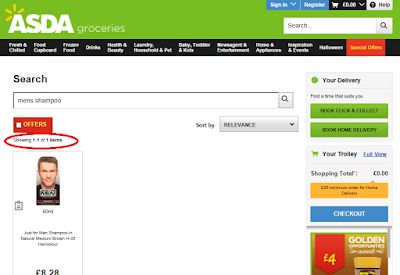
  “You mean kind of like on Asda?” asked Ron, who had been experimenting on his tablet.

Missing search results on Asda

  “Idiot boy,” snarled Snape. “Can’t you see they just aren’t managing their search properly? That isn’t a placement, it’s an opportunity. For what, Mr Malfoy?”
  “To include the words ‘Mens Shampoo’ in our product title, sir?”
  “Ten points to Slytherin. Exactly, Mr Malfoy. This site-search appears to only take the words in the product title as a literal term. Only this particular product in their range includes the two successive words ‘men shampoo’ in its title,” observed Snape.
  “So if we want to increase sales on Asda, we just get our product titles amended sir?”
  “Indeed we do. Shall we see how that might turn out, Mr Potter?”
  “Where sir?” asked Harry, very confused. Hermione’s hand shot up again.
  “Take a look at the Tesco grocery site everybody,” replied Snape, ignoring her as usual.

Search results on Tesco grocery

  “Here’s how it should work,” resumed Snape. “You will observe that any product that includes the word men and the word shampoo in its product title is appearing in the results.”
  “How does it decide what comes top then?” demanded Ron.
  “That information, Mr Weasley, is known only to the retailer. Unless, of course, Mr Malfoy…?”
  “We ask them, sir?”
  “Ten points to Slytherin. Indeed Mr Malfoy. We ask them. What do we ask them, Mr Potter?”
  “Errr, what generic search terms consumers use on their site and what factors apart from the words appearing in the product title drive the results-ranking, sir?”
  “It seems you are finally learning something in my classes, Mr Potter,” sneered Snape. “How do you think this one works then?” With a swipe of his hand, Snape showed the Boots site.


  “By magic, sir?” hazarded Harry.
  “Tut tut – fame clearly isn’t everything.”
  Harry tried not to look at Malfoy who was shaking with laughter.
  “As you can all see,” continued Snape loudly over the noises of Slytherin mirth, “retailer site search is an area that the skilled and cunning brand can manipulate to its advantage with surprisingly little effort. Some simple adjustments to absolute basics such as product data, combined with speaking to the retailer about a few specifics such as static links, can drive a significant sales uplift.”
  “For homework tonight, I want each of you to select a retailer website and brand, use this tool to benchmark it
Brand on Retailer Merchandising Benchmark Results Page

  “Bring three scrolls of parchment suggesting how you could make some simple adjustments to ensure your chosen brand features more prominently on the retailer’s site than its close competitors.”


Friday 25 September 2015

A Nation of Shopkeepers? A Guide to International and Cross-Border e-Commerce

On Thursday last week, I presented at IMRG's excellent cross-border ecommerce event.

IMRG, sponsored by Borderfree, commissioned me to write a detailed "how to do it" guide to trading internationally via ecommerce especially for the event (and made a lovely job of the graphic design too!):

The output is this 48-page in-depth guide to using e-commerce to sell your products to international customers. It's available to download by clicking on the picture.

The emphasis of the paper is on being a detailed, practical, "how to do it" guide. As well as being packed with facts and data, it also includes a dozen detailed checklists for developing a project plan, as well as many essential frameworks to help decide how, when, where, and of course whether international e-commerce could be a successful route-to-market for your brand.

Saturday 19 September 2015

Sherlock Holmes and the Case of the Brands Abused on Retailers’ Websites

"I am afraid, Watson, that I shall have to go," said Holmes, as we sat down together to our breakfast one morning.

“Go! Where to?”

 “To Dartmoor; to King's Pyland.”

“Then you will certainly need a new suitcase,” I replied.

“By Jove, Watson, you’re right. Here, take my tablet and search online for one. I have some small tasks I need to do in town before we depart for Dartmoor”.

And so I began my research. It soon seemed to me, however, that this was no easy matter. It was straightforward enough to locate the suitcase category on some retailers’ websites. But beyond there, the suitcases started to spin in front of me. No sooner had I focussed on one, than another, often apparently unrelated to the first, was suggested to me. In short, I was little further forward when Holmes burst back in through the door.

“I have solved the suitcase, Watson!” he cried. “Samsonite, red, 55cm, 4 wheels. The problem was a simple one.”

I was forced to confess that my surfing had not been so fruitful. As I stated to Holmes, I began my browsing on the John Lewis site.

“But the brand you chose yourself was not even proposed to me on this website,” I asserted firmly.

“Ah, Watson,” chuckled Holmes indulgently. “You see, but you do not observe! Surely it must have been obvious to you that you should have used this very small scroll bar lurking in the brand filter, scrolled down to those brands hidden beneath the filter mini-fold, and then, deducing that those small numbers in brackets represented the size of the range and remembering all the similar bracketed numbers higher up the list but now invisible after you scrolled down, observed that Samsonite, although ranked only as the 13th brand on the overall list due to alphabetic ordering, had the largest number of products on offer?”


I admitted that it had not, and that finding the brand-selection on this site somewhat dispiriting, I had instead proceeded to House of Fraser. There, however, I encountered a quite different problem.

“No sooner had I focussed on one brand,” I complained, “then the website tried to steer me to another.”


The smile faded from Holmes’ face. He took back the tablet, and tapped the screen repeatedly. His countenance took on a grim aspect.

“Here, Watson”, he said, showing me some photographs he had taken earlier, “is how the brands are displayed in the House of Fraser store.”


“Observe how every brand has its own display area in the store, with the product attractively merchandised to attract potential shoppers.”

 “See here, for example, how even a quite minor brand can win a place in the sun by being well-presented in the store.”


“And yet on these websites, any customer who pauses to look at one of their products is immediately steered towards a competitor.”

I felt a thrill of horror pass through me. “What is it, Holmes? What terrible monster is merchandising so beautifully in store, and yet abusing these respected brands online in this fashion?” I whispered.

“Indeed, in the age of the ROPO customer, it is doubly dreadful!” he responded.

“ROPO?”

“Research Online Purchase Offline. Some estimates put the percentage of in-store customers who behave this way as high as 87%,” he replied.

“There is one final test to perform,” he resumed. “Let us undertake this merchandising benchmarking scorecard.”

We entered our details into it, answered some few dozen multiple-choice questions, and studied the results together. My eye was immediately drawn to the headline percentage score, which did not seem so bad to me, but Holmes’ quicker intelligence was already scrutinising the detailed results further down the page.

“It’s as I thought,” he cried. “This benchmark is the final proof I was seeking.”

“What then is it, Holmes? What is the monster?”

“It is a feral recommendation-engine,” he replied sombrely. “When trained and regularly monitored, they help retailers to drive sales. But if allowed to run wild and unchecked, they become abusive and dangerous, obsessed with cross-selling brands over to their competitors.”

I must have look confused, for he continued, “the brand on retailer merchandising benchmark enumerates 16 different ways in which merchandising on retailers’ websites can be harmful to brands. Wild recommendation-engines are merely one such, albeit one of the most dangerous. Others include weak search-indexing, low category ranking, unmoderated reviews, inaccurate product descriptions, lousy photography…”

“What, then, would you advise brands to do?” I interrupted, as an understanding of the problem began to dawn on me.

“Elementary, my dear Watson! Just take as much interest in the merchandising of their products on retailers’ websites as they do of the merchandising in brick-and-mortar stores. The benchmark is merely a starting point of course, but it can help direct their initial review into the right areas. It’s part of understanding that Digital Transformation for brands needs to go far beyond just online marketing and social networking activities.”

So ended one of the darkest cases of Sherlock Holmes’ illustrious career. And yet, as he said, it proved to be only a beginning, and a long digital transformation struggle lies ahead for many brands to optimise their online partnership with their retailers as well as they have previously done so in-store so many years before. Fortunately, help is at hand.


Monday 14 September 2015

Visualising how fast is online retail in China *really* growing?

I've been doing some onsite engagements with a client in China in the last few months. Last time I visited, I managed to forget the power cable for my laptop. So my client very kindly ordered me a replacement online from JD.com, which arrived within 3 hours of the order being placed... OK Shanghai probably isn't representative of China as a whole (although JD says this service is available in 30 cities, total population > 300 million people!), but the impression you get of ecommerce while you're out there is fairly staggering. Certainly I've never seen so many people browsing their mobiles in one place as on the Shanghai metro, and every other advertising hoarding seemed to be for a retail website of some kind.

I've seen lots of graphs showing ecommerce growth in China, and separate graphs showing ecommerce growth in western countries, but I haven't really seen anything that puts the two in some sort of context. As I'm doing some research for the next edition of The Multichannel Retail Handbook at the moment, I happen to have been able to take the opportunity to set UK and Chinese official statistics side by side.

And here's the picture:


Roughly summarised:

1. Chinese retail as a whole is growing roughly as quickly as online retail in the UK. (CAGR of ~15%)

2. Chinese online retail is growing 4x faster than UK online retail (CAGR of ~60%)

Impressive stuff, a nice to see the on-the-ground impression confirmed in a side-by-side comparison. You can draw your own conclusions about whether China, despite its apparent recent economic wobble, is an interesting place to target online for retailers.

Data sources: UK Office of National Statistics, National Bureau of Statistics of China

Incidentally since the graph is inevitably a bit squeezed out for the slower growing lines, here's the same data with a logarithmic scale:


Back on stream

This blog has been neglected for a while, for the basic reason that I seem to have picked up more than my fair share of assignments that have required the creation of lengthy documents of various kinds. I've discovered that I appear to have a maximum quota for the quantity of reasonably intelligent words I can write in given period.

Oh yes, plus I've been moving house: you've probably done it, and you probably know that even a straightforward house-move (which ours certainly was not!) is impossibly energy draining.

Anyway, hopefully I'm back on stream with something at least moderately interesting to say. In the meantime, my post about UK click-and-collect penetration seems to have got picked up by several sites and I've even had a request to include the graph in a textbook. That particular post accounts for well over half the visitors to this blog, so I must have found something interesting to say at least once before...